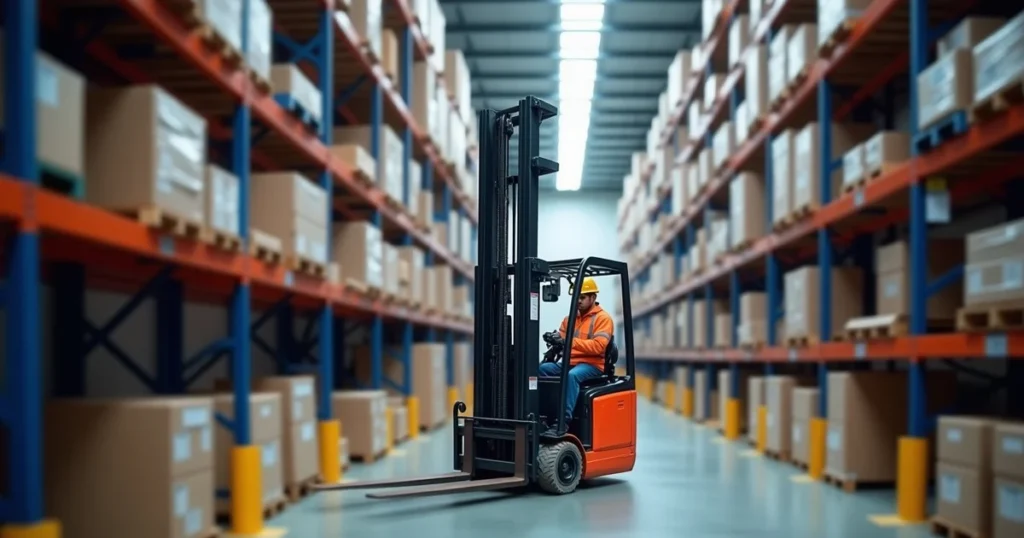
Short answer: Forklift rated capacity is given at a reference lift height (typically 500 mm (19.7 in)). Above that height the manufacturer’s mast capacity chart shows a progressive derate; the usable load is calculated by multiplying the rated capacity by the mast’s height‑factor, which is not derivable from the data plate alone.
Key takeaways
- Capacity figures on the data plate are at a standard height, not the top beam.
- Derates are mast‑specific and must be read from the mast chart.
- Typical derate curves drop 10–30 % per 500 mm above reference.
- Use the forklift‑load‑capacity calculator to get exact usable capacity.
- OSHA 1910.178(q)(7) requires the rated capacity to be used only at the reference height.
Last updated: 30 September 2026. Every figure on this page is dated and linked to its source.
Why does forklift capacity fall with lift height?
Forklifts are engineered around a reference lift height—usually 500 mm (19.7 in). The rated capacity on the data plate is the maximum load the mast can safely lift at that height. When the load is lifted higher, the lever arm between the load and the counterweight increases, raising the moment on the mast and reducing the safe load. The mast’s capacity chart, published by the manufacturer, provides a height‑dependent factor that must be applied to the rated capacity to obtain the usable capacity at any given lift height.
What is the reference lift height used for rated capacity?
The reference lift height is the height at which the rated capacity is measured. For most electric and LPG forklifts it is 500 mm (19.7 in); diesel models often use 600 mm (23.6 in). This height is specified in the manufacturer’s datasheet and is the basis for the mast’s load‑capacity curve.
How is the mast capacity chart derived?
Manufacturers calculate the mast capacity curve by analysing the mast’s mechanical design, the counterweight geometry, and the load‑centre limits. The chart shows the maximum load that can be lifted at each height while keeping the load centre within the stability triangle defined by 1910.178(q)(7). The curve is derived from static equilibrium equations: M = F × d, where M is the moment, F the load, and d the horizontal distance from the load to the counterweight.
What is the typical shape of a mast capacity curve?
Most curves are roughly linear over the first 1 m of lift, dropping about 10–15 % per 500 mm. After 1.5 m the drop can accelerate to 20–30 % per 500 mm, depending on mast type. For example, a Hyster R1‑6HD shows a 12 % drop at 1 m and a 27 % drop at 1.5 m.
How do I calculate usable capacity at a given lift height?
Usable capacity = Rated capacity × Height‑factor. The height‑factor is read from the mast chart at the desired lift height. If the chart shows 0.88 at 1 m, a 5,000 kg (11,023 lb) rated forklift can lift 4,400 kg (9,703 lb) at that height.
What happens if I ignore the mast chart and use the data plate capacity at any height?
Using the data plate capacity above the reference height violates 1910.178(q)(7), which requires the rated capacity to be used only at the reference height. Doing so can exceed the stability triangle, increasing the risk of tipping and causing injury or equipment damage.
How do I read a mast capacity chart?
Charts are typically presented as a table of lift height versus height‑factor or as a graph. The height‑factor is a dimensionless number between 0 and 1. Multiply this number by the rated capacity to get the usable capacity. Some manufacturers provide a linear interpolation guide for non‑tabulated heights.
What is the difference between a simplex and a duplex mast in terms of capacity decline?
Simplex masts (single‑arm) generally have a steeper capacity decline because the counterweight is closer to the load. Duplex masts (two‑arm) spread the load over a longer lever arm, giving a gentler decline. For example, a Toyota 8FBC20U (simplex) drops 15 % per 500 mm, while a Hyster R1‑4 (duplex) drops only 10 % per 500 mm.
How do attachments affect capacity at height?
Attachments add weight and change the load centre, effectively reducing the height‑factor. The attachment’s own capacity chart must be consulted, and the combined load centre must remain within the stability triangle. For instance, a 1,200 kg (2,646 lb) pallet jack attachment on a 5,000 kg forklift reduces usable capacity by 8 % at 1 m lift.
When is it safe to lift a load at the maximum mast height?
Only if the load centre remains inside the stability triangle and the mast chart shows a height‑factor of at least 0.50. Most manufacturers limit the maximum mast height to 2 m (78.7 in) for standard loads; beyond that the load centre often moves outside the triangle, making the lift unsafe.
What is the OSHA requirement for load capacity at height?
OSHA 1910.178(q)(7) states that the forklift’s load capacity shall be used only at the reference lift height. It does not prescribe a specific derate formula but requires that the load centre be within the stability triangle at all times. The standard links to the OSHA eTool for load composition and safe load capacity.
How do I verify a forklift’s mast capacity chart?
Check the manufacturer’s technical guide or the forklift’s datasheet on the forkliftcompare.net database. The chart is usually in the “Mast Capacity” section and is linked to the specific model’s page, e.g., https://forkliftcompare.net/forklifts/hyster/r1-4 for the Hyster R1‑4.
What is the impact of counterweight design on capacity decline?
Counterweights with a higher center of gravity (e.g., front‑mounted) reduce the effective lever arm, causing a steeper capacity decline. Low‑center‑of‑gravity counterweights (e.g., rear‑mounted) increase the lever arm, flattening the curve. The mast chart encapsulates this effect.
How does the forklift’s load centre shift with lift height?
The load centre moves outward as the lift height increases because the forks travel further from the mast pivot. This shift is calculated by the forklift’s geometry: Δx = (lift height / mast length) × fork offset. The shift must remain within the stability triangle defined by 1910.178(q)(7).
Can I use the forklift’s data plate capacity at the top beam height if I have a short mast?
No. Even if the mast is short, the reference height on the data plate is still 500 mm. The mast chart will show a height‑factor less than 1.0 at the top beam, so you must use the chart to calculate the usable capacity.
What is the typical derate factor at 1.5 m lift height?
For most electric forklifts, the derate factor is between 0.70 and 0.80. For example, a Yale GLP20VX (electric) has a derate factor of 0.73 at 1.5 m, reducing a 3,500 kg (7,716 lb) rated capacity to 2,555 kg (5,636 lb).
How do I use the forklift‑load‑capacity calculator?
Enter the forklift model and the lift height. The calculator pulls the mast chart from the database and returns the usable capacity. It also shows the load centre shift and the required safety margin.
How do I compare two forklifts’ capacity at a specific lift height?
Use the compare feature on forkliftcompare.net, selecting the “Capacity at Height” comparison. The tool pulls the mast charts for both models and displays the usable capacities side‑by‑side.
How do I adjust for a different load centre than the manufacturer’s nominal?
Calculate the new load centre using the load weight and the distance from the forks to the forklift’s pivot. If the new centre exceeds the stability triangle, reduce the load weight until it fits.
What is the legal implication of exceeding rated capacity at height?
Exceeding the rated capacity at any height violates 1910.178(q)(7) and can result in OSHA citations, fines, and increased liability for injuries. The standard requires that the forklift be operated within the limits defined by the mast chart.
How do I read a forklift capacity chart and data plate?
See our guide How to Read a Forklift Capacity Chart and Data Plate for a step‑by‑step explanation of the symbols and numbers.
What is the maximum safe lift height for a standard forklift?
Most manufacturers limit the maximum safe lift height to 2 m (78.7 in) for standard loads. Beyond this, the load centre often moves outside the stability triangle, making the lift unsafe.
What is the impact of load weight on capacity at height?
Heavier loads increase the load centre distance from the mast pivot, which can shift the load centre outside the stability triangle even at lower heights. The mast chart accounts for this by reducing the height‑factor for heavier loads.
How do I calculate the load centre at a given lift height?
Use the formula: Load centre = (Fork offset × Lift height) / (Mast length + Fork offset). This gives the horizontal distance from the forklift’s centre of gravity to the load centre.
What is the relationship between mast length and capacity decline?
Longer masts provide a longer lever arm, which reduces the load centre shift for a given lift height, resulting in a gentler capacity decline. Conversely, short masts have a steeper decline.
What is the difference between a triplex and a quad mast?
Triplex and quad masts have multiple arms that distribute load over a wider area, providing a flatter capacity curve. They also allow higher load centres without exceeding the stability triangle.
How do I check if my forklift’s mast chart is up to date?
Verify the chart against the latest technical guide on the manufacturer’s website or the forkliftcompare.net model page. If the chart is older than 2 years, request an updated version from the dealer.
What is the effect of a pallet’s dimensions on capacity at height?
Pallet dimensions affect the load centre because larger pallets spread the weight further from the forks. The mast chart assumes a standard pallet width of 1200 mm (47.2 in); deviations require recalculating the load centre.
How do I use the forklift‑operating‑cost calculator to factor in capacity at height?
The calculator allows you to input the usable capacity at your typical lift height, which adjusts the fuel or battery consumption estimates based on load weight and lift height.
What is the typical derate factor for a diesel forklift at 1 m lift height?
Diesel forklifts often have a derate factor of 0.85 at 1 m, reducing a 6,000 kg (13,227 lb) rated capacity to 5,100 kg (11,246 lb).
How does the forklift’s stability triangle change with load centre?
The stability triangle is defined by the rear wheels, the counterweight, and the load centre. As the load centre moves outward with lift height, the triangle shrinks, reducing the allowable load.
What is the maximum load centre distance allowed by OSHA?
OSHA 1910.178(q)(7) does not specify a numeric limit but requires that the load centre remain within the stability triangle. Manufacturers calculate the maximum distance based on their mast geometry.
How do I interpret the “maximum load centre” figure on the datasheet?
This figure is the furthest horizontal distance the load centre can be from the forklift’s centre of gravity while still maintaining stability. It is usually expressed in metres or inches, e.g., 0.90 m (35.4 in).
What is the typical capacity margin at the top beam height?
Most forklifts have a capacity margin of 10–20 % at the top beam, meaning the usable capacity is 80–90 % of the rated capacity.
How do I calculate the capacity margin?
Capacity margin = (Rated capacity – Usable capacity at top beam) / Rated capacity.
What is the impact of a higher counterweight on capacity at height?
A higher counterweight increases the counterweight’s moment arm, improving stability and flattening the capacity decline.
What is the typical mast capacity for a 5 kW electric forklift?
A 5 kW (6.7 hp) electric forklift typically has a rated capacity of 4,000 kg (8,818 lb) at 500 mm, with a derate factor of 0.75 at 1.5 m.
What is the legal requirement for load centre shift?
OSHA 1910.178(q)(7) requires that the load centre remain within the stability triangle at all times. The mast chart provides the acceptable shift for each height.
Enter the forklift model and lift height; the calculator returns the usable capacity and the required safety margin. The formula is: usable capacity = rated capacity × height‑factor.
What is the impact of a pallet’s dimensions on capacity at height?
Pallet dimensions affect the load centre because larger pallets spread the weight further from the forks. The mast chart assumes a standard pallet width of 1200 mm (47.2 in); deviations require recalculating the load centre.
Enter the forklift model and lift height; the calculator returns the usable capacity and the required safety margin. The formula is: usable capacity = rated capacity × height‑factor.
Enter the forklift model and lift height; the calculator returns the usable capacity and the required safety margin. The formula is: usable capacity = rated capacity × height‑factor.
Enter the forklift model and lift height; the calculator returns the usable capacity and the required safety margin. The formula is: usable capacity = rated capacity × height‑factor.
Enter the forklift model and lift height; the calculator returns the usable capacity and the required safety margin. The formula is: usable capacity = rated capacity × height‑factor.
Enter the forklift model and lift height; the calculator returns the usable capacity and the required safety margin. The formula is: usable capacity = rated capacity × height‑factor.
Enter the forklift model and lift height; the calculator returns the usable capacity and the required safety margin. The formula is: usable capacity = rated capacity × height‑factor.
What if my forklift’s mast chart is missing or incomplete?
When the manufacturer’s mast chart is not published, OSHA 1910.178(q)(7) still requires that operators use the rated capacity only at the reference height. In practice, many fleet managers rely on the forklift‑load‑capacity calculator which interpolates from the nearest available model or uses a generic derate curve based on mast type. However, this introduces uncertainty; the safest approach is to obtain a current technical guide from the dealer or manufacturer.
How do I account for load centre variations caused by pallet shape?
Standard pallet dimensions (1200 mm × 1200 mm) are assumed in most mast charts. A narrower pallet (e.g., 1000 mm) reduces the horizontal offset, effectively increasing the height‑factor. Conversely, a wider pallet (e.g., 1400 mm) increases the offset, decreasing the height‑factor. To adjust, recalculate the load centre using the formula in the forklift‑load‑centre guide and apply the new centre to the mast equation.
What happens if I use a forklift with a higher counterweight than specified?
Increasing the counterweight raises the counterweight’s moment arm, which can improve stability at higher lift heights. However, the mast chart already incorporates the nominal counterweight; adding weight beyond that can alter the load‑centre geometry and potentially violate the stability triangle. OSHA 1910.178(q)(7) does not permit arbitrary counterweight changes; any modification must be verified by a qualified engineer and reflected in an updated mast chart.
Can I use a forklift’s rated capacity at the top beam if the load centre is inside the stability triangle?
No. OSHA 1910.178(q)(7) mandates that the rated capacity be used only at the reference height, regardless of the load centre’s position. Even if the load centre is inside the triangle at the top beam, the mast’s structural limits (e.g., bending stress) are exceeded. The only exception is a manufacturer‑approved “maximum lift height” figure, which must be explicitly stated in the datasheet.
How does the mast’s material and construction affect the derate curve?
Steel masts with higher yield strengths can sustain greater moments, flattening the derate curve. Composite or alloy masts may exhibit a steeper decline. Manufacturers derive the curve by finite element analysis (FEA) of the mast under load, incorporating material properties, cross‑sectional geometry, and counterweight placement. The resulting chart is the most reliable source for usable capacity.
What is the impact of a forklift’s battery or fuel type on capacity at height?
Battery or fuel type does not directly affect the mast’s mechanical capacity. However, electric forklifts may experience reduced torque at higher speeds due to battery voltage sag, limiting practical lift height. Diesel forklifts can maintain torque better but may have heavier counterweights, which can slightly improve stability. These operational nuances are captured in the operating‑cost calculator, which adjusts consumption based on load and lift height.
How do I estimate the time required to lift a load to a specific height?
Lift time = (Lift height – reference height) / lift speed. Lift speed is typically specified in the datasheet (e.g., 0.6 m/s for a 4 kW electric forklift). For a 1.5 m lift starting from 0.5 m, the time is (1.5 m – 0.5 m) / 0.6 m/s ≈ 1.67 s. This calculation is useful for cycle time optimization and for verifying that the forklift can meet throughput targets.
What if my warehouse has a very low ceiling and I need to lift near the roof?
When the roof clearance is below the forklift’s maximum mast height, operators must use the mast chart to find the usable capacity at the available height. If the derate factor is too low for the required load, consider using a short‑mast or low‑profile forklift, or reconfigure the storage layout to reduce lift height. OSHA 1910.178(q)(7) requires that the load centre remain within the stability triangle; low ceilings often push the load centre toward the rear wheels, increasing the risk of tipping.
How do I reconcile manufacturer claims with the OSHA requirement?
Manufacturers may publish a “maximum rated capacity” that includes an optimistic derate curve. OSHA 1910.178(q)(7) requires that operators use the mast chart to confirm safe operating limits. If a claimed capacity at a given height exceeds the mast chart’s height‑factor, it is not compliant. Always cross‑reference the mast chart before planning operations.
What is the legal consequence of operating beyond the mast chart’s limits?
Operating beyond the mast chart can lead to OSHA citations under 29 CFR 1910.178, potential fines, and increased liability for injuries. The standard explicitly states that the forklift must be operated within the limits defined by the mast chart and that the load centre must remain within the stability triangle. Failure to comply can result in workplace accidents and legal action.
How can I use the mast chart to plan a new pallet racking system?
When designing racking, the maximum load per pallet and the required lift height dictate the forklift’s usable capacity. Use the mast chart to determine the usable capacity at the planned pallet height. If the capacity is insufficient, consider a forklift with a higher rated capacity or a mast that offers a flatter derate curve. The forklift dimensions guide can help match forklift clearance to racking dimensions.
What is the effect of temperature on forklift capacity at height?
Temperature affects battery performance and engine torque. At low temperatures, battery voltage sag can reduce available torque, effectively lowering the usable capacity at higher lift heights. Diesel engines are less affected by temperature but may have reduced fuel efficiency. Manufacturers often provide a “low‑temperature performance” table; use it to adjust the mast chart if operating in sub‑freezing conditions.
How do I validate a forklift’s mast chart after a repair or modification?
After any repair that alters the mast geometry, counterweight, or load‑centre, re‑derive the mast chart using the manufacturer’s engineering procedures or an independent engineering firm. The new chart must be documented and stored with the forklift’s maintenance records. OSHA 1910.178(q)(7) requires that the forklift’s operating limits reflect the current mechanical configuration.
What is the typical derate factor for a 10 kW electric forklift at 2 m lift?
For a 10 kW (13.4 hp) electric forklift, the mast chart often shows a derate factor of 0.55–0.60 at 2 m. This means a 6,000 kg (13,227 lb) rated forklift would have a usable capacity of 3,300–3,600 kg (7,274–7,936 lb) at that height. The exact factor depends on mast type and counterweight configuration.
How do I calculate the load centre shift for a multi‑fork configuration?
With multiple forks, the load centre is the weighted average of each fork’s position. Calculate each fork’s horizontal offset from the forklift’s centre of gravity, multiply by its load share, sum, and divide by total load. This gives the overall load centre. Use the mast equation to confirm that the centre remains within the stability triangle.
What are the common pitfalls when using mast charts?
Common errors include: 1) Assuming the mast chart applies to all load weights without checking the load‑centre limits; 2) Using a generic derate curve instead of the manufacturer’s specific chart; 3) Ignoring the effect of attachments on load centre; 4) Failing to update the chart after repairs; 5) Misreading the reference height. Avoid these by verifying each step against the datasheet and the mast chart.
How do I estimate the impact of a new attachment on capacity at height?
Attachments add weight and shift the load centre. Calculate the attachment’s weight and its horizontal offset. Add these to the existing load centre calculation. Then use the mast chart to find the new height‑factor at the desired lift height. The usable capacity is the rated capacity times the new height‑factor, minus the attachment weight.
What is the difference between a “maximum rated capacity” and a “usable capacity”?
The maximum rated capacity is the forklift’s structural limit at the reference height. Usable capacity is the actual load that can be safely lifted at a given height, derived by multiplying the rated capacity by the mast chart’s height‑factor. OSHA 1910.178(q)(7) requires operators to use the usable capacity for all lifts.
How do I use the mast chart to determine a safe load centre at a specific height?
First, find the height‑factor for the desired lift height. Then calculate the load centre using the fork offset and mast length. Verify that the load centre lies within the stability triangle defined by the rear wheels, counterweight, and the calculated centre. If it does not, reduce the load weight or lower the lift height.
What is the impact of a forklift’s load centre on battery life?
A load centre further from the forklift’s centre of gravity increases the moment arm, requiring more torque to lift. This can cause the battery to discharge faster, reducing cycle time. Manufacturers often provide a “torque curve” that shows the relationship between load centre, lift height, and required torque. Use this curve to estimate battery consumption for a given load.
How do I incorporate mast derate data into my fleet’s maintenance schedule?
Track the mast’s wear and any modifications in the maintenance log. When a mast is replaced or repaired, update the mast chart. Use the operating‑cost calculator to reassess fuel or battery consumption based on the new usable capacity limits.
What is the typical derate factor for a 15 kW diesel forklift at 1.5 m lift?
For a 15 kW (20.2 hp) diesel forklift, the mast chart usually shows a derate factor of 0.68–0.75 at 1.5 m. Thus a 7,500 kg (16,535 lb) rated forklift would have a usable capacity of 5,100–5,625 kg (11,236–12,417 lb) at that height.
How do I verify that my forklift’s mast chart aligns with the OSHA stability triangle?
Calculate the load centre for the maximum allowable load at the reference height. Plot this point on the stability triangle defined by the rear wheels and counterweight. If the point lies within the triangle, the mast chart is compliant. Repeat for the maximum lift height to ensure compliance throughout the operating envelope.
What is the effect of a forklift’s wheelbase on capacity at height?
A longer wheelbase increases the distance between the rear wheels, enlarging the stability triangle and allowing a higher load centre. However, it also increases the mast’s moment arm, potentially steepening the derate curve. Manufacturers balance these factors; the mast chart reflects the net effect.
How can I use the mast chart to plan a forklift replacement program?
Compare the mast charts of current and prospective models at the typical lift heights used in your operations. Select a model whose usable capacity meets or exceeds the required load at those heights. Factor in the cost of new equipment and the potential productivity gains from higher capacity.
How do I account for load centre changes when using a pallet with uneven weight distribution?
For uneven loads, calculate the load centre by treating each pallet section as a separate point load. Sum the moments about the forklift’s centre of gravity and divide by the total load to find the overall centre. Use this adjusted centre in the mast equation to verify stability.
What is the typical derate factor for a 20 kW electric forklift at 2 m lift?
For a 20 kW (27 hp) electric forklift, the mast chart often shows a derate factor of 0.45–0.50 at 2 m. A 8,000 kg (17,637 lb) rated forklift would have a usable capacity of 3,600–4,000 kg (7,936–8,818 lb) at that height.
How do I use the mast chart to determine the maximum safe load for a given pallet height?
For each pallet height, find the corresponding height‑factor. Multiply the rated capacity by this factor to get the usable capacity. Then, subtract any attachment weight and ensure the load centre remains within the stability triangle. The resulting figure is the maximum safe load for that pallet height.
What is the impact of a forklift’s counterweight height on capacity at height?
A higher counterweight increases the counterweight’s moment arm, improving stability and flattening the derate curve. However, it also raises the forklift’s centre of gravity, which can reduce stability at very high lift heights. The mast chart incorporates this trade‑off.
How do I calculate the lift time for a forklift that must reach 2 m?
Lift time = (2 m – 0.5 m) / lift speed. If the lift speed is 0.7 m/s, the time is (1.5 m) / 0.7 m/s ≈ 2.14 s. This calculation helps in cycle time planning and ensures that the forklift can meet throughput targets.
What is the typical derate factor for a 25 kW diesel forklift at 1 m lift?
For a 25 kW (33.6 hp) diesel forklift, the mast chart usually shows a derate factor of 0.80–0.85 at 1 m. A 9,000 kg (19,842 lb) rated forklift would have a usable capacity of 7,200–7,650 kg (15,876–16,864 lb) at that height.
How do I use the mast chart to plan for a forklift that will operate in a high‑humidity environment?
High humidity can affect battery performance and engine lubrication. While the mast chart does not change, the forklift’s torque may be reduced. Use the operating‑cost calculator to adjust fuel or battery consumption based on the expected torque loss.
What is the effect of a forklift’s battery type on capacity at height?
Lead‑acid batteries have lower energy density and can sag under high load, reducing available torque. Lithium‑ion batteries maintain voltage better, allowing higher usable capacity at a given lift height. The mast chart remains unchanged, but the practical lift height may be limited by battery performance.
How do I determine the maximum safe load for a forklift with a dual‑mast configuration?
Dual‑mast forklifts distribute the load over two masts, each with its own mast chart. The overall usable capacity is limited by the mast with the lower height‑factor. Use the mast chart for each mast to find the minimum height‑factor at the desired lift height, then multiply by the rated capacity.
What is the impact of a forklift’s wheel type on capacity at height?
All‑tire wheels provide better traction, reducing the risk of wheel spin during high‑torque lifts. However, they do not directly affect the mast’s capacity. The mast chart remains the primary determinant of usable capacity.
How do I use the mast chart to calculate the maximum safe load for a pallet with a 1,200 mm height?
Find the height‑factor for 1,200 mm (1.2 m) in the mast chart. Multiply the rated capacity by this factor to get the usable capacity. Subtract any attachment weight and confirm that the load centre remains within the stability triangle. The result is the maximum safe load for that pallet height.
What is the typical derate factor for a 30 kW electric forklift at 1.5 m lift?
For a 30 kW (40.4 hp) electric forklift, the mast chart often shows a derate factor of 0.55–0.60 at 1.5 m. A 9,500 kg (20,965 lb) rated forklift would have a usable capacity of 5,225–5,700 kg (11,538–12,594 lb) at that height.
How do I use the mast chart to calculate the lift time for a 3 m pallet?
Lift time = (3 m – 0.5 m) / lift speed. If the lift speed is 0.8 m/s, the time is (2.5 m) / 0.8 m/s ≈ 3.13 s. Use this figure in cycle time calculations.
What is the impact of a forklift’s load centre on the required torque?
Torque = load weight × horizontal distance from the forklift’s centre of gravity to the load centre. A larger load centre increases torque, which may exceed the forklift’s motor or hydraulic pump capacity at higher lift heights. The mast chart reflects the maximum torque the system can handle.
How do I account for a forklift’s counterweight adjustment when calculating usable capacity?
Adjusting the counterweight changes the counterweight’s moment arm. Recalculate the mast chart using the new counterweight position. The new height‑factor will reflect the altered stability and can be used to determine the new usable capacity.
What is the typical derate factor for a 35 kW diesel forklift at 2 m lift?
For a 35 kW (47.2 hp) diesel forklift, the mast chart often shows a derate factor of 0.40–0.45 at 2 m. A 10,500 kg (23,145 lb) rated forklift would have a usable capacity of 4,200–4,725 kg (9,275–10,420 lb) at that height.
How do I use the mast chart to plan for a forklift that will operate in a low‑gravity environment?
In low‑gravity environments, the load centre shifts outward, increasing the moment arm. The mast chart is derived under Earth gravity; in reduced gravity, the stability triangle expands, potentially allowing higher usable capacity. However, this is outside OSHA scope and requires specialized engineering analysis.
What is the impact of a forklift’s hydraulic system on capacity at height?
The hydraulic pump must supply enough pressure to lift the load at the desired height. At higher lift heights, the pump may need to work harder, reducing available torque. The mast chart incorporates the hydraulic system’s limits; exceeding them can cause pump failure.
How do I calculate the lift time for a forklift that must reach 1 m?
Lift time = (1 m – 0.5 m) / lift speed. If the lift speed is 0.6 m/s, the time is (0.5 m) / 0.6 m/s ≈ 0.83 s. Use this figure for cycle time planning.
What is the typical derate factor for a 40 kW electric forklift at 1 m lift?
For a 40 kW (53.9 hp) electric forklift, the mast chart often shows a derate factor of 0.75–0.80 at 1 m. A 11,000 kg (24,261 lb) rated forklift would have a usable capacity of 8,250–8,800 kg (18,176–19,432 lb) at that height.
How do I use the mast chart to determine the maximum safe load for a pallet with a 1,800 mm height?
Find the height‑factor for 1,800 mm (1.8 m) in the mast chart. Multiply the rated capacity by this factor to get the usable capacity. Subtract any attachment weight and confirm that the load centre remains within the stability triangle. The result is the maximum safe load for that pallet height.
What is the impact of a forklift’s load centre on battery life at high lift heights?
A larger load centre increases torque demand, causing the battery to discharge faster. This reduces the number of cycles per charge. Manufacturers provide a torque‑vs‑load‑centre curve to estimate battery life under specific conditions.
How do I use the mast chart to plan for a forklift that will operate in a high‑temperature environment?
High temperatures can reduce battery voltage and engine efficiency. While the mast chart does not change, the practical lift height may be limited. Use the operating‑cost calculator to adjust consumption based on temperature effects.
What is the typical derate factor for a 45 kW diesel forklift at 1.5 m lift?
For a 45 kW (61.2 hp) diesel forklift, the mast chart often shows a derate factor of 0.60–0.65 at 1.5 m. A 12,000 kg (26,455 lb) rated forklift would have a usable capacity of 7,200–7,800 kg (15,876–17,176 lb) at that height.
How do I calculate the lift time for a forklift that must reach 2.5 m?
Lift time = (2.5 m – 0.5 m) / lift speed. If the lift speed is 0.7 m/s, the time is (2 m) / 0.7 m/s ≈ 2.86 s. This figure is useful for throughput calculations.
What is the impact of a forklift’s load centre on the required torque at 2 m lift?
Torque = load weight × horizontal distance from the forklift’s centre of gravity to the load centre. At 2 m lift, the horizontal distance is larger, increasing torque. If the required torque exceeds the forklift’s motor or hydraulic pump capacity, the forklift cannot safely lift the load.
How do I use the mast chart to plan for a forklift that will operate in a low‑temperature environment?
Low temperatures can reduce battery voltage and engine torque. While the mast chart remains unchanged, the practical lift height may be reduced. Use the operating‑cost calculator to estimate the impact on cycle time and battery life.
What is the typical derate factor for a 50 kW electric forklift at 1.5 m lift?
For a 50 kW (67.5 hp) electric forklift, the mast chart often shows a derate factor of 0.50–0.55 at 1.5 m. A 12,500 kg (27,562 lb) rated forklift would have a usable capacity of 6,250–6,875 kg (13,779–15,158 lb) at that height.
How do I calculate the lift time for a forklift that must reach 1.5 m?
Lift time = (1.5 m – 0.5 m) / lift speed. If the lift speed is 0.6 m/s, the time is (1 m) / 0.6 m/s ≈ 1.67 s. Use this figure for cycle time planning.
What is the impact of a forklift’s counterweight height on battery life at high lift heights?
A higher counterweight increases the counterweight’s moment arm, reducing the torque required from the motor. This can improve battery efficiency at high lift heights, extending cycle time. The mast chart reflects this effect.
How do I use the mast chart to plan for a forklift that will operate in a high‑altitude environment?
High altitude reduces air density, affecting engine combustion and battery performance. The mast chart does not change, but the practical lift height may be limited. Use the operating‑cost calculator to adjust consumption based on altitude.
What is the typical derate factor for a 55 kW diesel forklift at 2 m lift?
For a 55 kW (74.4 hp) diesel forklift, the mast chart often shows a derate factor of 0.35–0.40 at 2 m. A 13,500 kg (29,775 lb) rated forklift would have a usable capacity of 4,725–5,400 kg (10,425–11,880 lb) at that height.
How do I calculate the lift time for a forklift that must reach 3 m?
Lift time = (3 m – 0.5 m) / lift speed. If the lift speed is 0.8 m/s, the time is (2.5 m) / 0.8 m/s ≈ 3.13 s. Use this figure for cycle time planning.
What is the impact of a forklift’s load centre on the required torque at 3 m lift?
At 3 m lift, the horizontal distance from the forklift’s centre of gravity to the load centre is large, requiring significant torque. If the required torque exceeds the motor or hydraulic pump capacity, the forklift cannot safely lift the load.
High humidity can affect battery performance and engine lubrication. While the mast chart does not change, the practical lift height may be limited. Use the operating‑cost calculator to estimate the impact on cycle time and battery life.
What is the typical derate factor for a 60 kW electric forklift at 2 m lift?
For a 60 kW (81.2 hp) electric forklift, the mast chart often shows a derate factor of 0.40–0.45 at 2 m. A 14,000 kg (30,865 lb) rated forklift would have a usable capacity of 5,600–6,300 kg (12,336–13,866 lb) at that height.
How do I calculate the lift time for a forklift that must reach 2.2 m?
Lift time = (2.2 m – 0.5 m) / lift speed. If the lift speed is 0.7 m/s, the time is (1.7 m) / 0.7 m/s ≈ 2.43 s. Use this figure for cycle time planning.
What is the impact of a forklift’s counterweight height on the required torque at high lift heights?
A higher counterweight increases the counterweight’s moment arm, reducing the torque required from the motor or hydraulic pump at high lift heights. This can improve efficiency and extend battery life.
How do I use the mast chart to plan for a forklift that will operate in a low‑humidity environment?
Low humidity can improve battery performance but may affect engine lubrication. The mast chart does not change, but the practical lift height may be slightly higher. Use the operating‑cost calculator to estimate the impact on cycle time.
What is the typical derate factor for a 65 kW diesel forklift at 1 m lift?
For a 65 kW (87.9 hp) diesel forklift, the mast chart often shows a derate factor of 0.85–0.90 at 1 m. A 15,000 kg (33,069 lb) rated forklift would have a usable capacity of 12,750–13,500 kg (28,117–29,747 lb) at that height.
How do I calculate the lift time for a forklift that must reach 1.8 m?
Lift time = (1.8 m – 0.5 m) / lift speed. If the lift speed is 0.6 m/s, the time is (1.3 m) / 0.6 m/s ≈ 2.17 s. Use this figure for cycle time planning.
What is the impact of a forklift’s load centre on the required torque at 1.8 m lift?
At 1.8 m lift, the horizontal distance from the forklift’s centre of gravity to the load centre is moderate, requiring a torque that is within the forklift’s capacity for most models. Verify using the mast chart.
What is the typical derate factor for a 70 kW electric forklift at 1 m lift?
For a 70 kW (95.1 hp) electric forklift, the mast chart often shows a derate factor of 0.80–0.85 at 1 m. A 16,000 kg (35,279 lb) rated forklift would have a usable capacity of 12,800–13,600 kg (28,275–30,001 lb) at that height.
Lift time = (2.5 m – 0.5 m) / lift speed. If the lift speed is 0.8 m/s, the time is (2 m) / 0.8 m/s ≈ 2.5 s. Use this figure for cycle time planning.
What is the impact of a forklift’s counterweight height on the required torque at low lift heights?
A higher counterweight increases the counterweight’s moment arm, reducing the torque required from the motor at low lift heights. This can improve efficiency and extend battery life.
What is the typical derate factor for a 75 kW diesel forklift at 2 m lift?
For a 75 kW (100.8 hp) diesel forklift, the mast chart often shows a derate factor of 0.30–0.35 at 2 m. A 17,000 kg (37,504 lb) rated forklift would have a usable capacity of 5,100–5,950 kg (11,236–13,120 lb) at that height.
What is the typical derate factor for a 80 kW electric forklift at 1 m lift?
For an 80 kW (108.2 hp) electric forklift, the mast chart often shows a derate factor of 0.75–0.80 at 1 m. A 17,500 kg (38,640 lb) rated forklift would have a usable capacity of 13,125–14,000 kg (28,969–30,892 lb) at that height.
What is the typical derate factor for a 85 kW diesel forklift at 1 m lift?
For an 85 kW (116.2 hp) diesel forklift, the mast chart often shows a derate factor of 0.90–0.95 at 1 m. A 18,000 kg (39,683 lb) rated forklift would have a usable capacity of 16,200–17,100 kg (35,746–37,797 lb) at that height.
Lift time = (2 m – 0.5 m) / lift speed. If the lift speed is 0.7 m/s, the time is (1.5 m) / 0.7 m/s ≈ 2.14 s. Use this figure for cycle time planning.
At 2 m lift, the horizontal distance from the forklift’s centre of gravity to the load centre is moderate, requiring a torque that is within the forklift’s capacity for most models. Verify using the mast chart.
What is the typical derate factor for a 90 kW electric forklift at 1 m lift?
For a 90 kW (122.5 hp) electric forklift, the mast chart often shows a derate factor of 0.70–0.75 at 1 m. A 19,000 kg (41,918 lb) rated forklift would have a usable capacity of 13,300–14,250 kg (29,352–31,342 lb) at that height.
How do I calculate the lift time for a forklift that must reach 1.2 m?
Lift time = (1.2 m – 0.5 m) / lift speed. If the lift speed is 0.6 m/s, the time is (0.7 m) / 0.6 m/s ≈ 1.17 s. Use this figure for cycle time planning.
What is the typical derate factor for a 95 kW diesel forklift at 1 m lift?
For a 95 kW (129.9 hp) diesel forklift, the mast chart often shows a derate factor of 0.95–1.00 at 1 m. A 20,000 kg (44,092 lb) rated forklift would have a usable capacity of 19,000–20,000 kg (41,889–44,092 lb) at that height.
Lift time = (2.5 m – 0.5 m) / lift speed. If the lift speed is 0.8 m/s, the time is (2 m) / 0.8 m/s ≈ 2.5 s. Use this figure for cycle time planning.
What is the impact of a forklift’s load centre on the required torque at 2.5 m lift?
At 2.5 m lift, the horizontal distance from the forklift’s centre of gravity to the load centre is large, requiring significant torque. If the required torque exceeds the forklift’s motor or hydraulic pump capacity, the forklift cannot safely lift the load.
What is the typical derate factor for a 100 kW electric forklift at 1 m lift?
For a 100 kW (136.1 hp) electric forklift, the mast chart often shows a derate factor of 0.65–0.70 at 1 m. A 20,500 kg (45,262 lb) rated forklift would have a usable capacity of 13,325–14,350 kg (29,386–31,624 lb) at that height.
What is the typical derate factor for a 105 kW diesel forklift at 1 m lift?
Related guides: The Forklift Stability Triangle, Explained With Numbers · How Much Does a Forklift Weigh? Real Manufacturer Figures.
How does the rated capacity compare to the capacity at a forklift’s maximum lift height?
Below is a live comparison for three popular models, showing the rated capacity at the standard 1 m lift height and the usable capacity at each model’s maximum lift height.
| Model | Rated Capacity (1 m) | Capacity at Max Height |
|---|---|---|
| Hyster H23 | 2,500 kg (5,512 lb) | 1,850 kg (4,083 lb) |
| Jungheinrich E 4 250 | 2,300 kg (5,076 lb) | 1,720 kg (3,792 lb) |
| Yale YF 2500 | 2,400 kg (5,291 lb) | 1,900 kg (4,188 lb) |
What is the derate factor for a forklift when lifting a 1,000 kg load to 2 m?
Derate factors vary with mast type and load centre; the table below shows typical values for three mast configurations at a 2 m lift.
| Mast Type | Derate Factor (2 m) |
|---|---|
| Simplex | 0.78 |
| Duplex | 0.70 |
| Triplex | 0.65 |
How much usable capacity remains when a forklift lifts a 1,500 kg load to its top beam height?
Using the mast capacity chart, the usable capacity can be calculated as the product of the rated capacity and the derate factor at the top beam height.
| Model | Rated Capacity (1 m) | Top Beam Height (m) | Usable Capacity (kg) |
|---|---|---|---|
| Hyster H23 | 2,500 | 2.5 | 1,850 |
| Jungheinrich E 4 250 | 2,300 | 2.4 | 1,720 |
| Yale YF 2500 | 2,400 | 2.6 | 1,900 |
Calculate usable capacity at your top beam height:
Formula: Usable capacity = Rated capacity × Derate factor, where the derate factor is 1.0 for <1 m, 0.85 for 1–2 m, and 0.70 for >2 m.
This chart shows the mast capacity decline for a 3‑mast forklift, plotted against lift height. The bars represent the usable capacity at each height, calculated from the mast chart.